Stuck at the plateau
You're doing €5M+ a year but keep hitting the same revenue ceiling, no matter what growth tactic you try.

DRIP growth protocol
Built from 4,000+ winning experiments. The protocol increases revenue per user by finding why unfamiliar shoppers hesitate, testing the right conversion signals, and compounding what the brand learns every month.
How brands grow: more strangers and light buyers enter memory, understand the offer, trust the signal, and make the first purchase.
01 / Proof and fit
The protocol came from 4,000+ experiments, 250+ ecommerce brands, and the pressure of making cold traffic profitable when acquisition costs keep climbing.
You're doing €5M+ a year but keep hitting the same revenue ceiling, no matter what growth tactic you try.
You want a methodical way to lift conversion rate and AOV — not intuition, not competitor copying.
You suspect the website, PDP, PLP, cart, or checkout is killing profitable acquisition, but no one can prove it.
You want every validated test to make the next one smarter, cheaper, and more likely to win.
Not for
02 / Why trust this
The protocol came from public work, peer-reviewed research, and a decade inside real stores. Below is the credibility layer — concrete artifacts you can inspect, not claims you have to take on faith.
It started in 2019 with a comment on a LinkedIn post. SNOCKS was doing €150K/month at the time. They gave us something most agencies never get: full access. Their dev team, their analytics, their design files — everything.
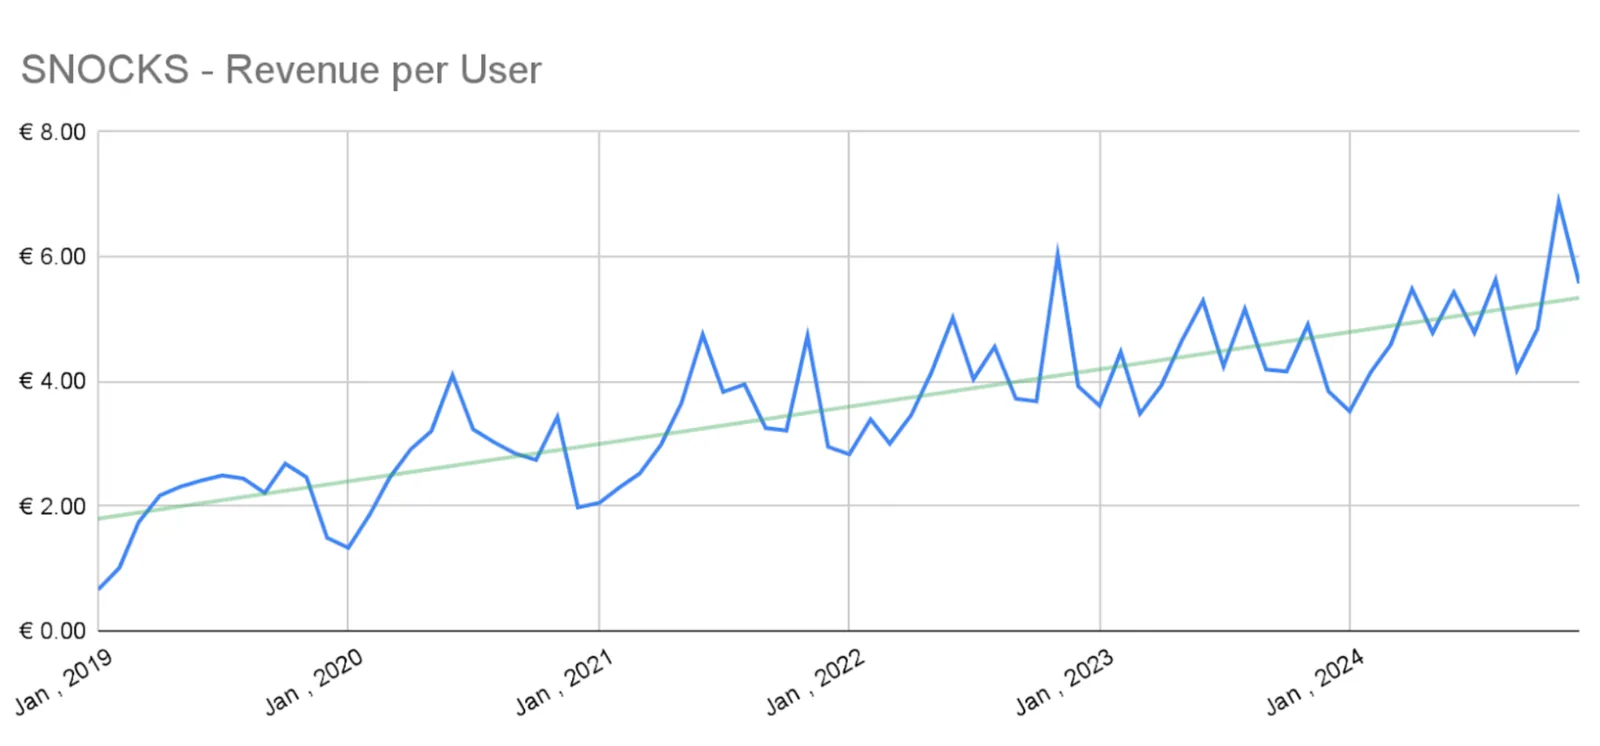
Over five years, we ran 450+ experiments for SNOCKS. We saw how compounding CRO actually works at scale — which ideas hold up under real traffic, how small changes affect big revenue, and how to build a system that runs dozens of tests without breaking things.
SNOCKS grew from €3M to €80M+ annually. They didn't just keep working with us — they became one of our earliest investors.
Along the way, we documented 4,000+ A/B tests, co-published peer-reviewed research, and broke down the method on the top ecommerce podcasts in DACH.
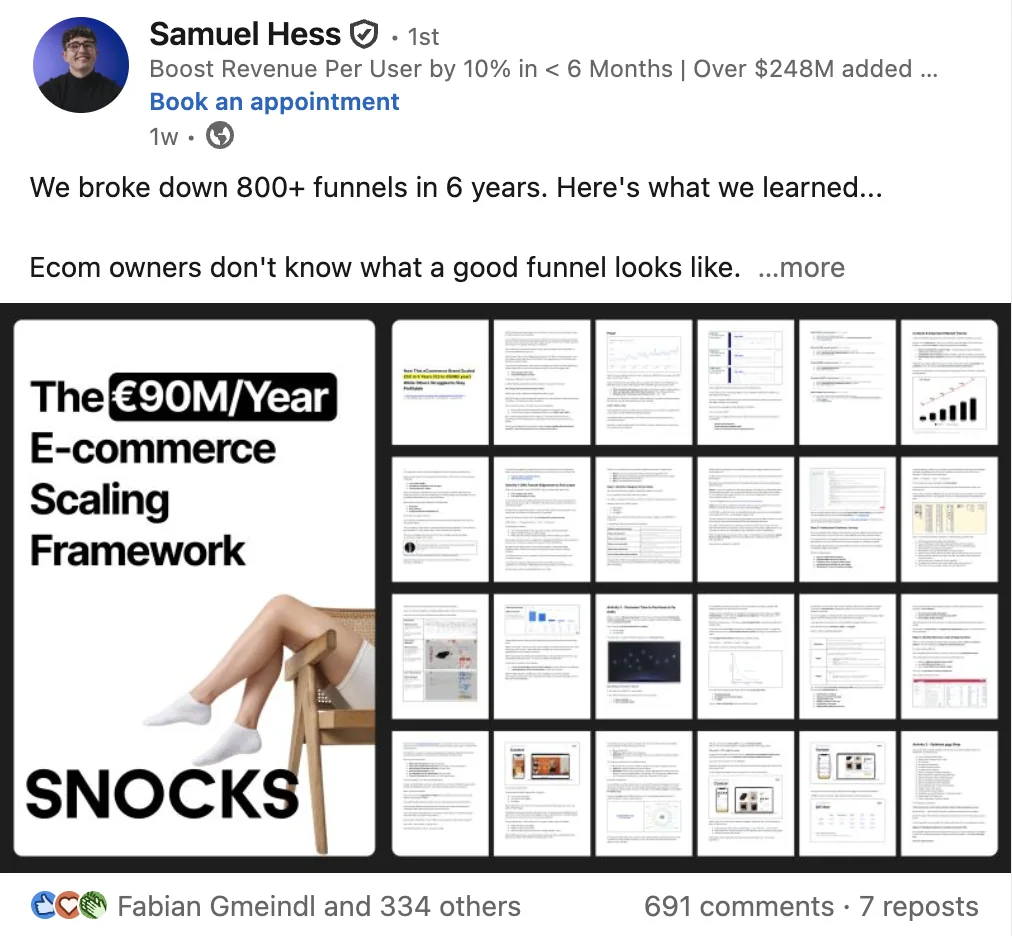
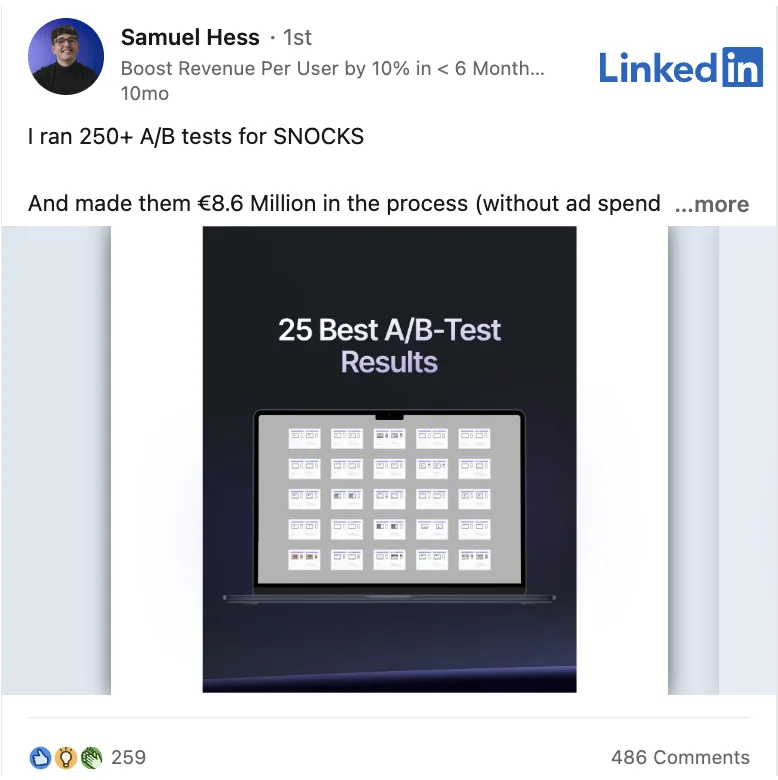
From €150K/month to €80M+ annual revenue. 450+ experiments. SNOCKS later became an early investor in DRIP.
DRIP co-authored field research on differential price framing in a peer-reviewed marketing journal. No other CRO agency in DACH has done this.
Samuel and the team have broken down the method on the top ecommerce shows in the German-speaking world.
We publish concrete test libraries, frameworks, and result breakdowns. No vague before/afters. No black-box claims.
03 / Why it matters now
Brands grow when more category buyers, including strangers and light buyers, remember them, trust them, and make a first purchase. Retention cannot carry an 8-figure brand if acquisition stops working.
The thesis
Most future buyers are not loyal fans yet. They arrive with low attention, low trust, and weak memory of the brand. The protocol exists to make those people buy more often, with every test strengthening the next acquisition cycle.
Growth comes from more category buyers choosing you more often, especially light buyers and first-time shoppers.
Paid acquisition fails when strangers arrive, hesitate, and leave before the brand has entered memory.
The protocol turns research signals into tests that make unfamiliar shoppers understand, trust, and buy faster.
At 8-figure scale, a 1-2% shift in acquisition efficiency can mean millions gained or lost. The core issue is converting strangers profitably before competitors do.
Retention matters, but brands usually grow by expanding the buyer base. Declining brands often retain normally and simply fail to bring enough new people in.
Most markets are dominated by people who buy rarely, know little about you, and have low loyalty. The page has to work for them first.
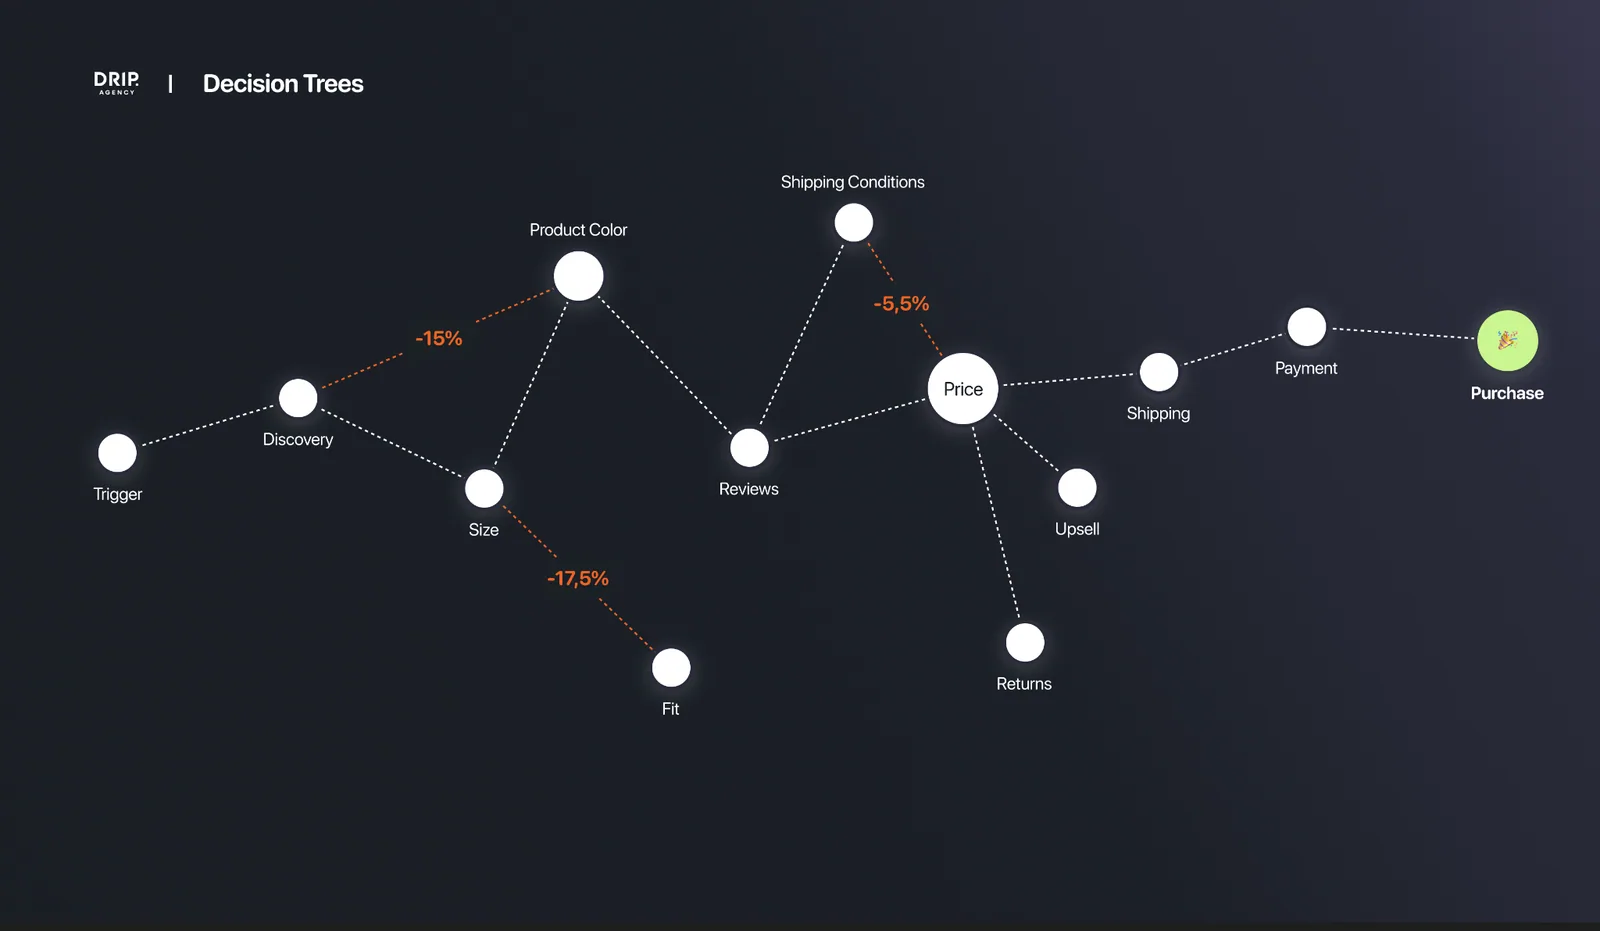
People do not calmly compare every option. Cues, context and category entry points retrieve brands from memory in seconds, which is why the funnel has to encode the right signals.
04 / The first-principles model
The page won't hide the math. First, we improve how many strangers buy and how much they spend. Then the operating system scales the quality, rate, and success rate of every test we run.
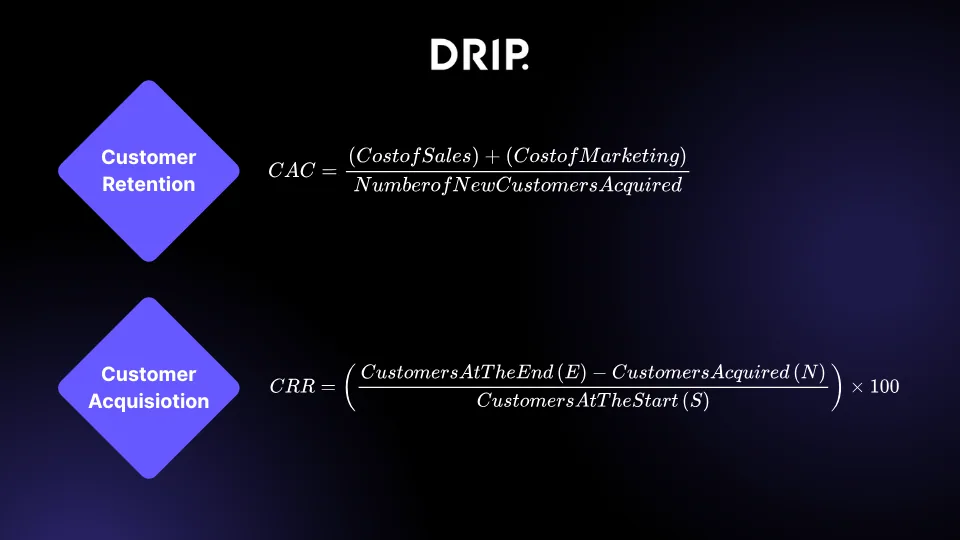
How well the funnel aligns with what consumers want — consciously and subconsciously.
How quickly the team can test, refine, and ship validated changes.
How often the next decision is a winner instead of a random idea.
05 / The three-part system
The formula is deliberately simple: better test ideas, more high-quality shots on goal, and a roadmap that learns from every result.
Research outputs
Testing guardrails
01
Predictive consumer research
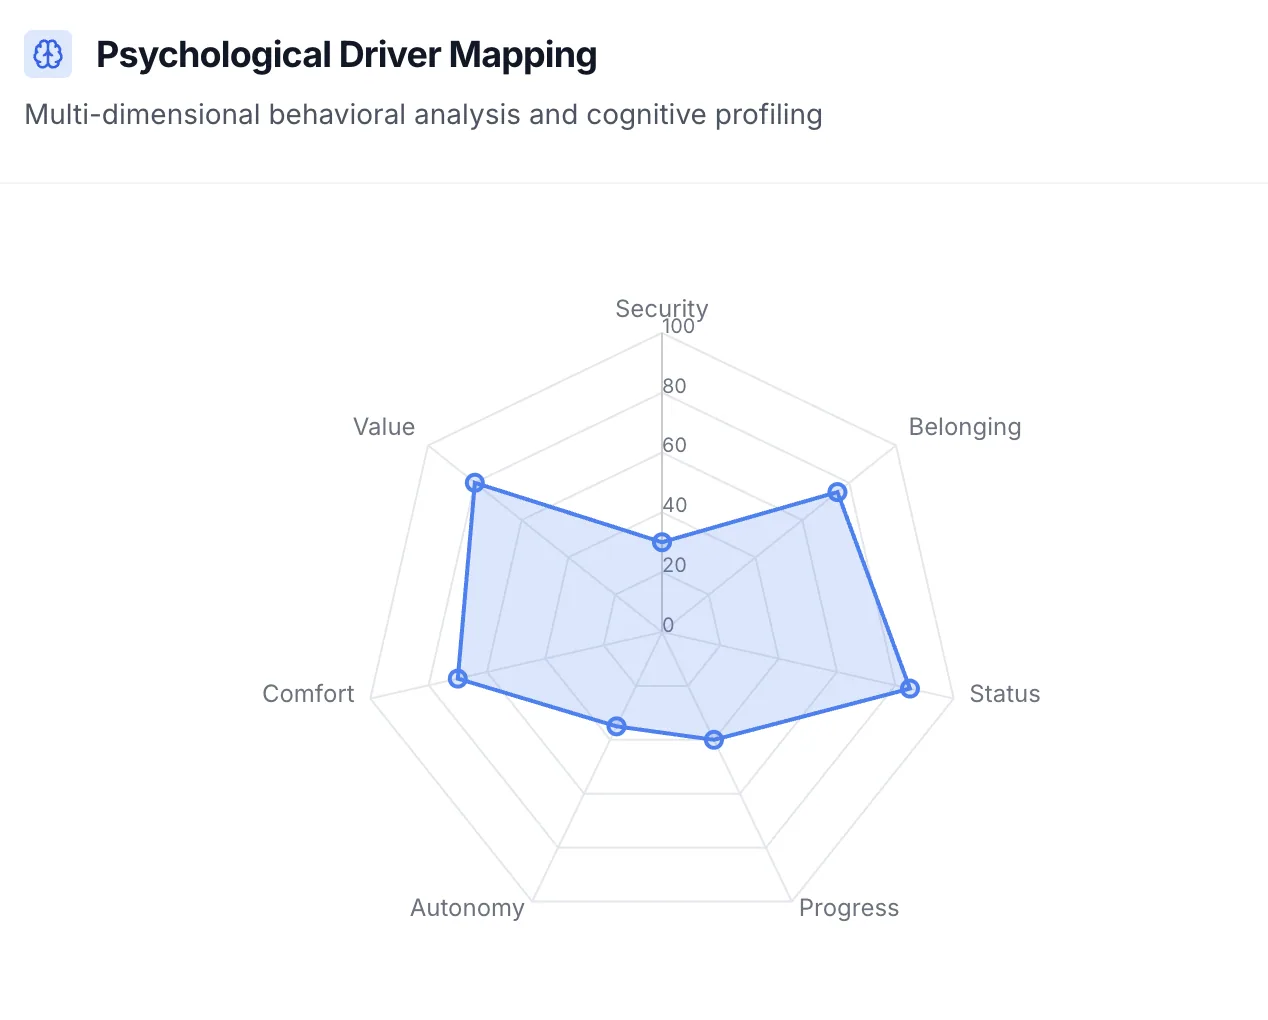
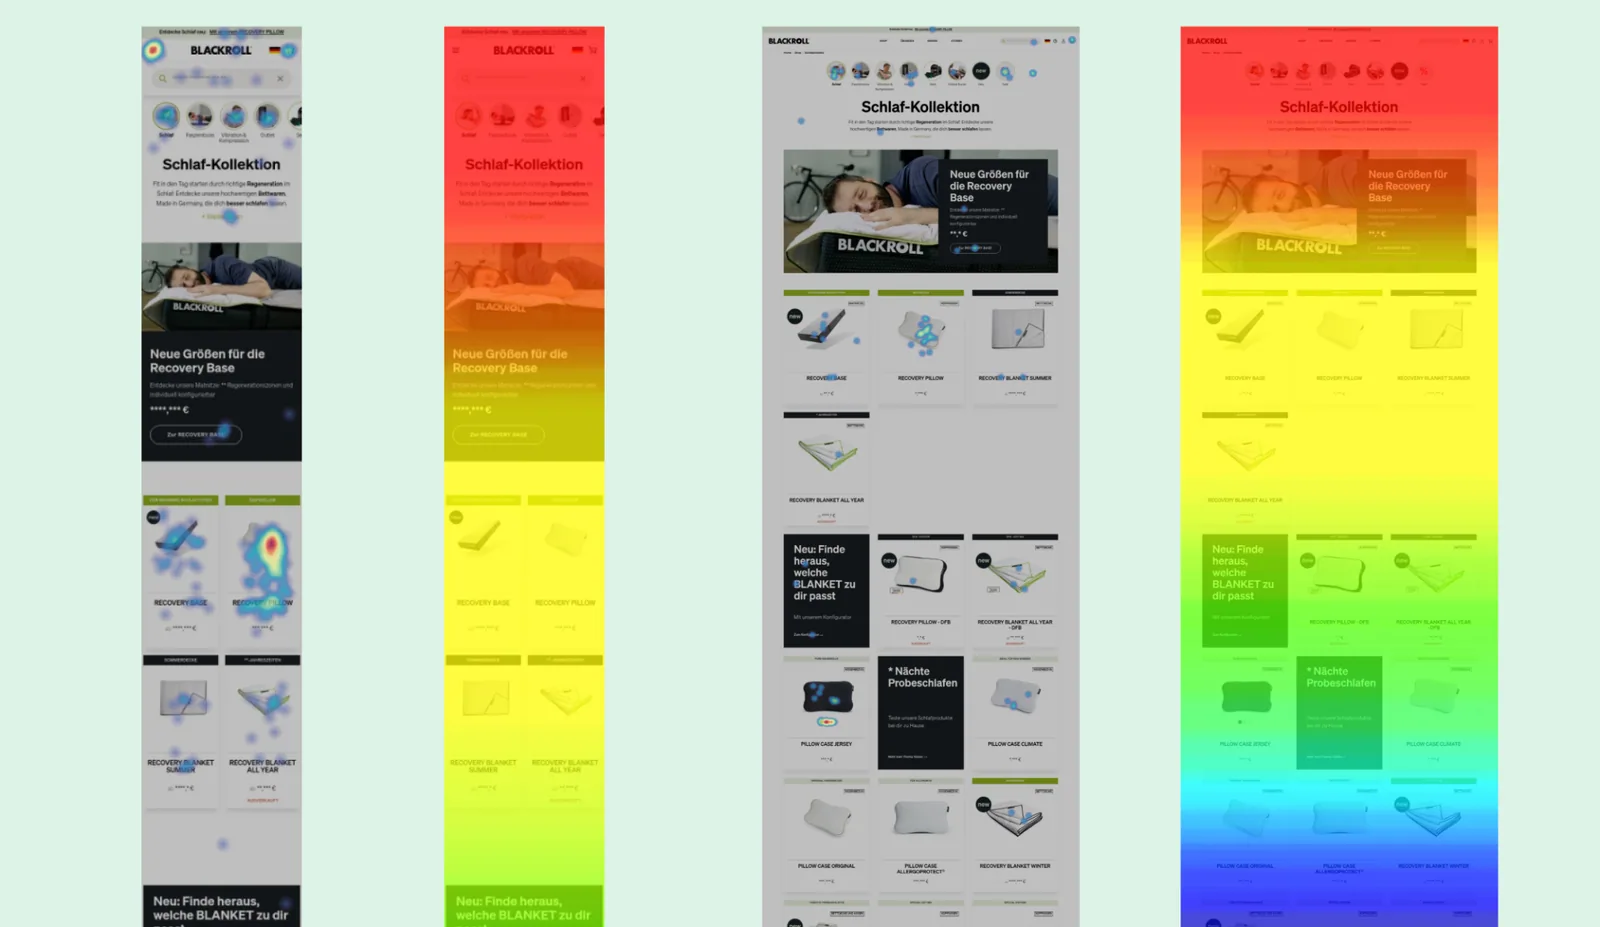
Before we write a single hypothesis, we map customer psychology, category entry points, funnel behavior, page attention, and competitor context.
The output is not a PDF that dies in Slack.
It becomes the research layer for every test that follows.
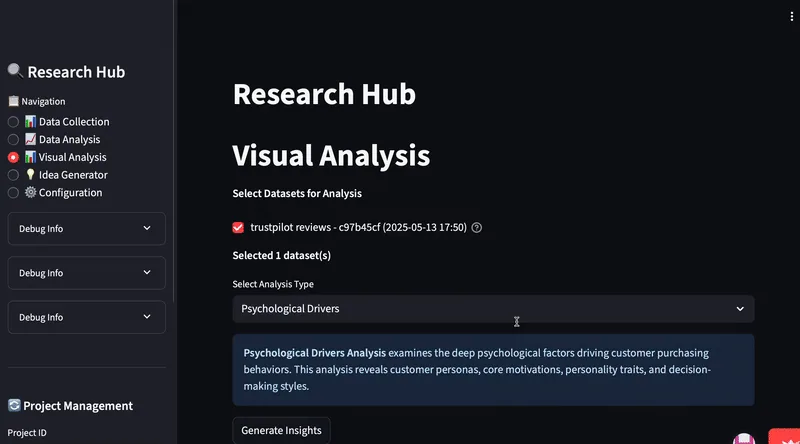
Reviews, surveys, social comments, competitor sites and forums become motivations, psychological drivers, CEPs and feature language.
We map who people buy with, where, why, when, with what and how they feel when buying.
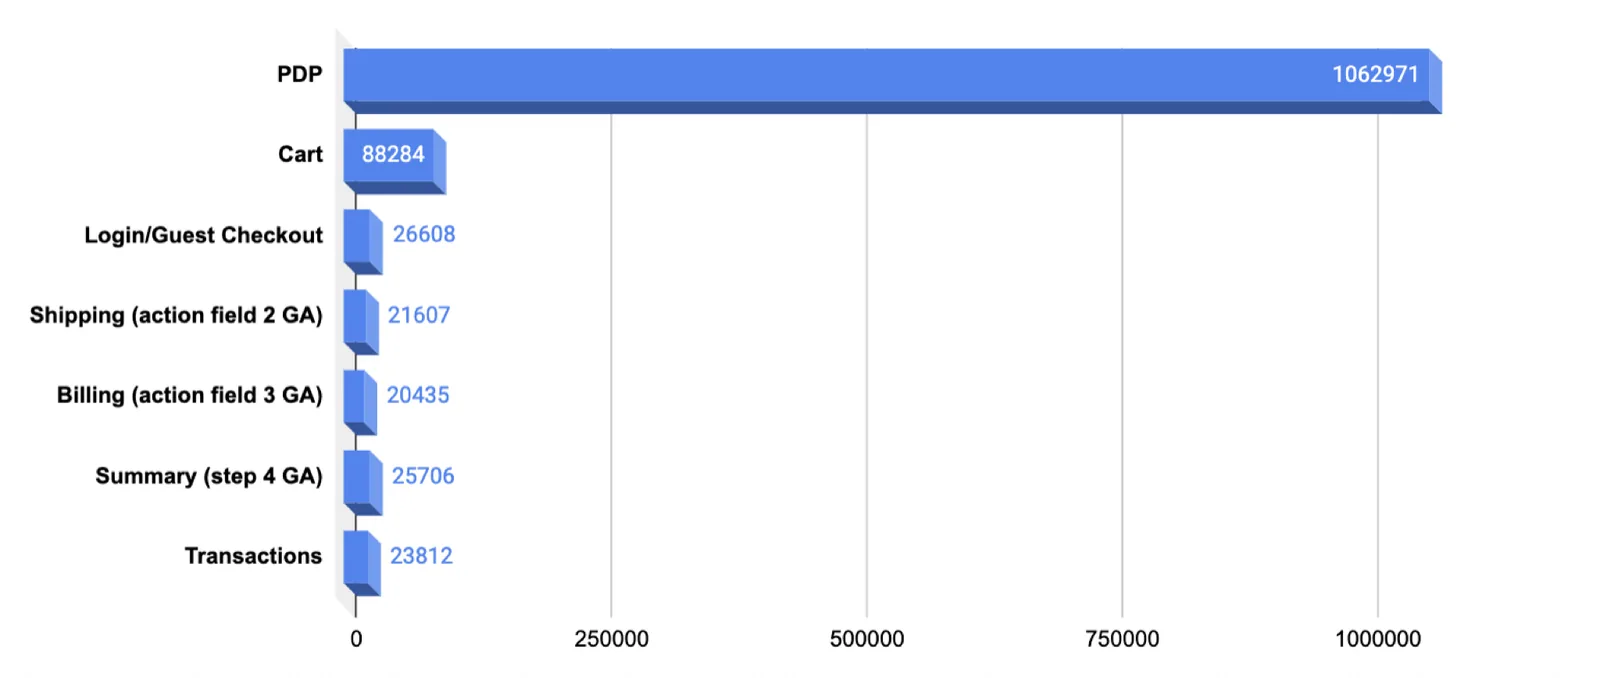
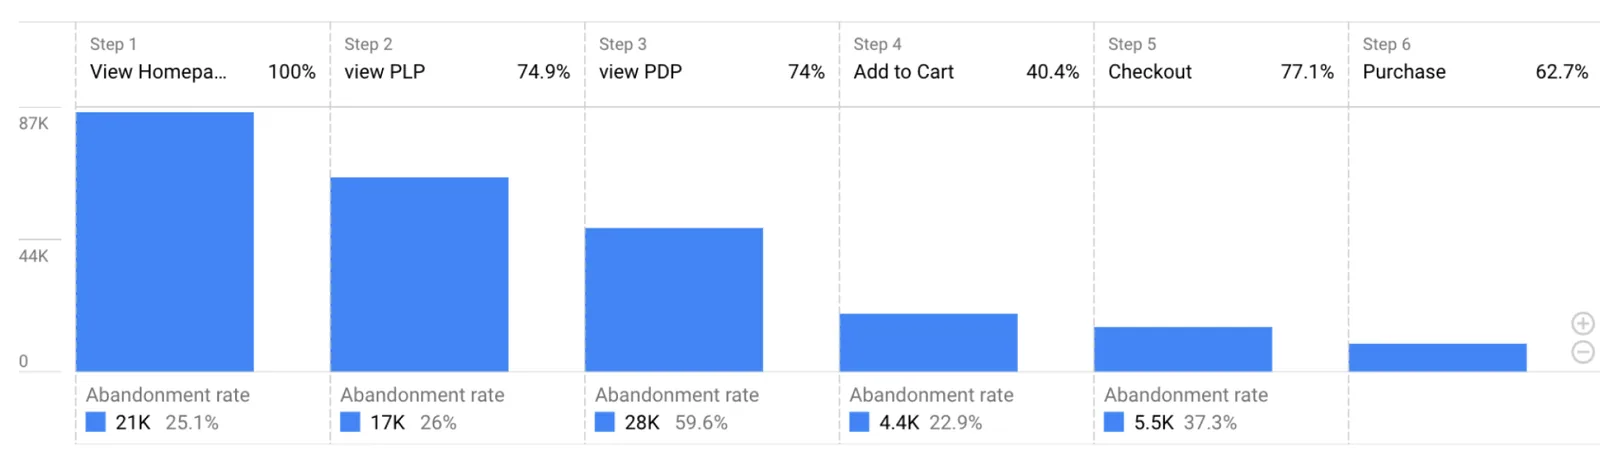
Heatmaps, recordings, analytics, filters, payment behavior and full-funnel drop-offs expose where money is leaking.
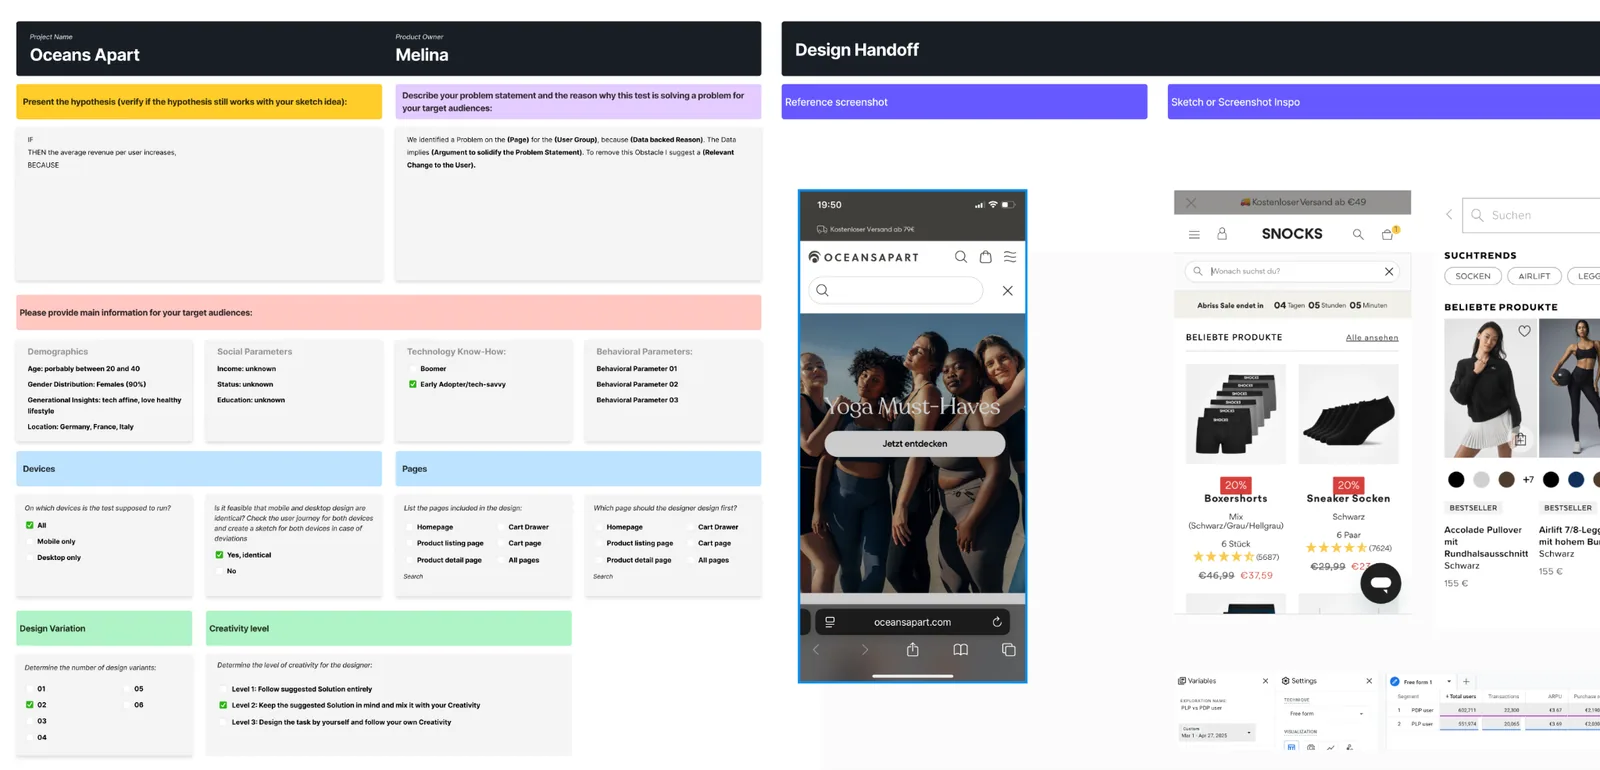
Every test is framed as a hypothesis tied to a motivator, friction point or category entry point.
Customer signals are translated into testable if / then / because logic.
02
Rapid A/B testing
Most programs run one test at a time and call it rigorous.
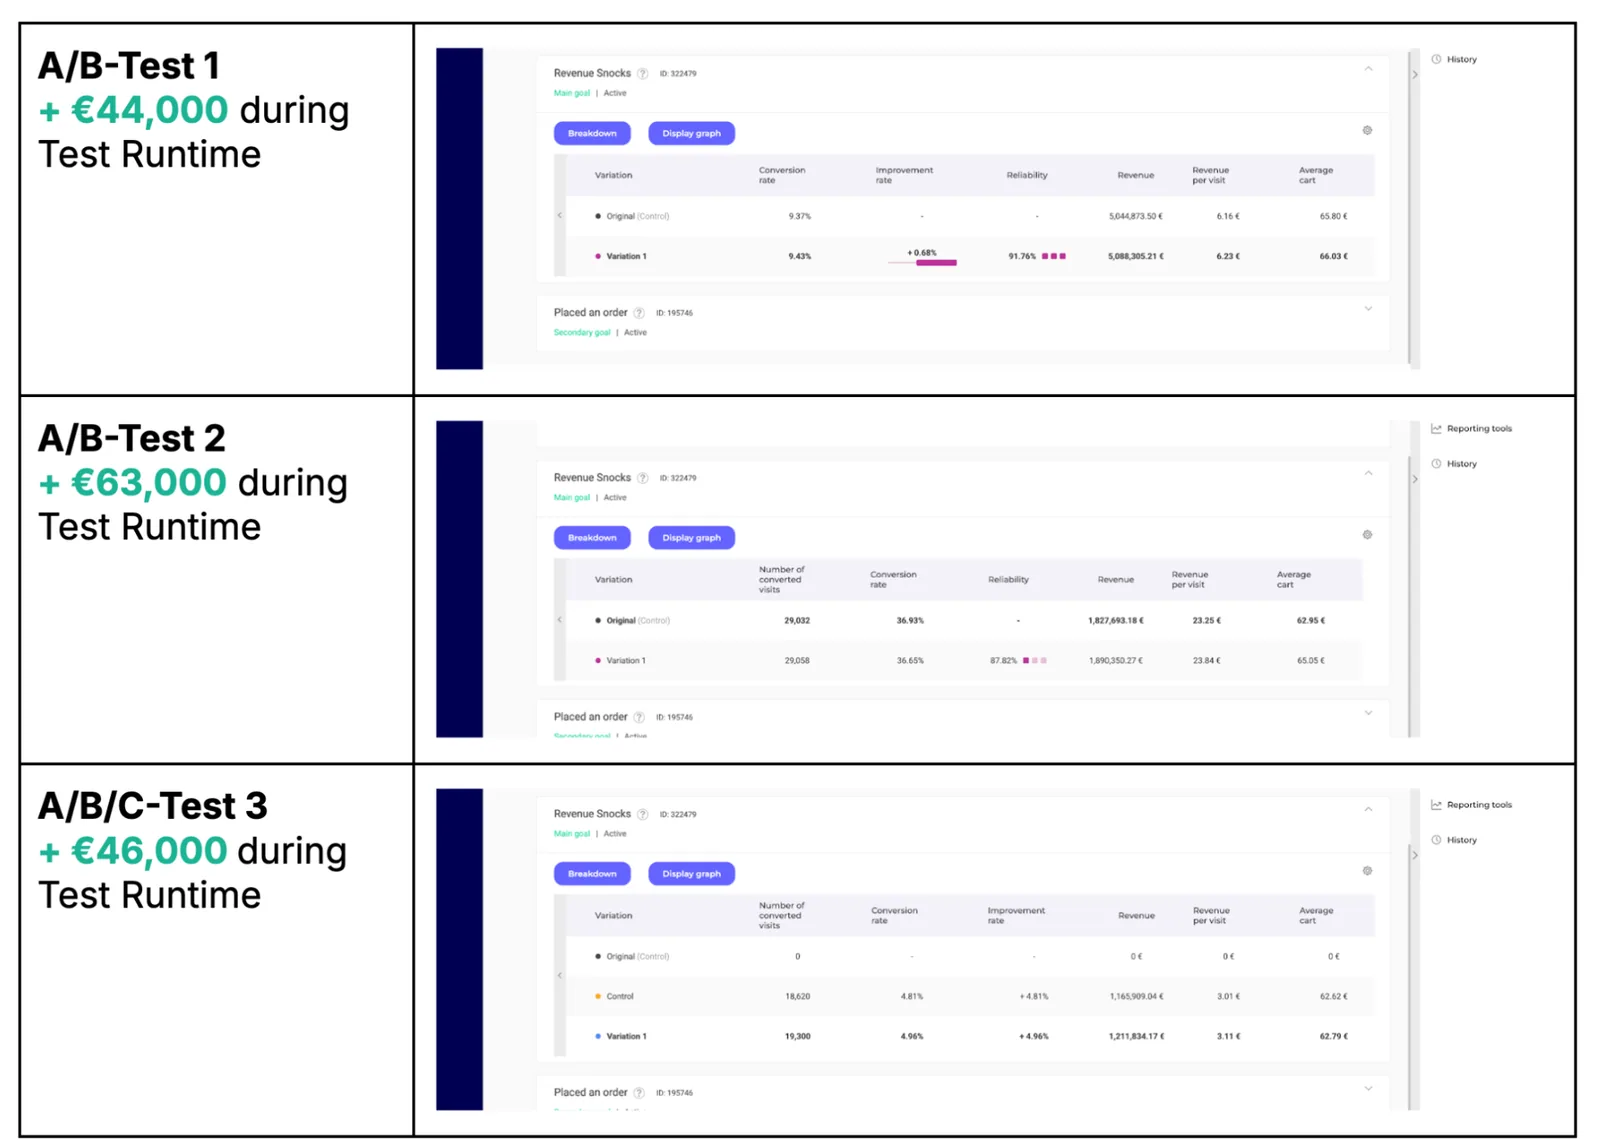
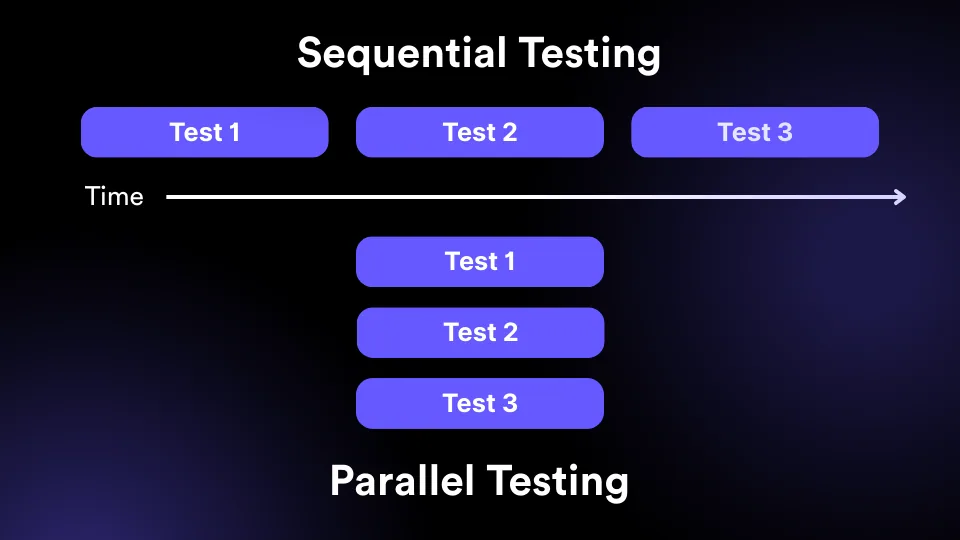
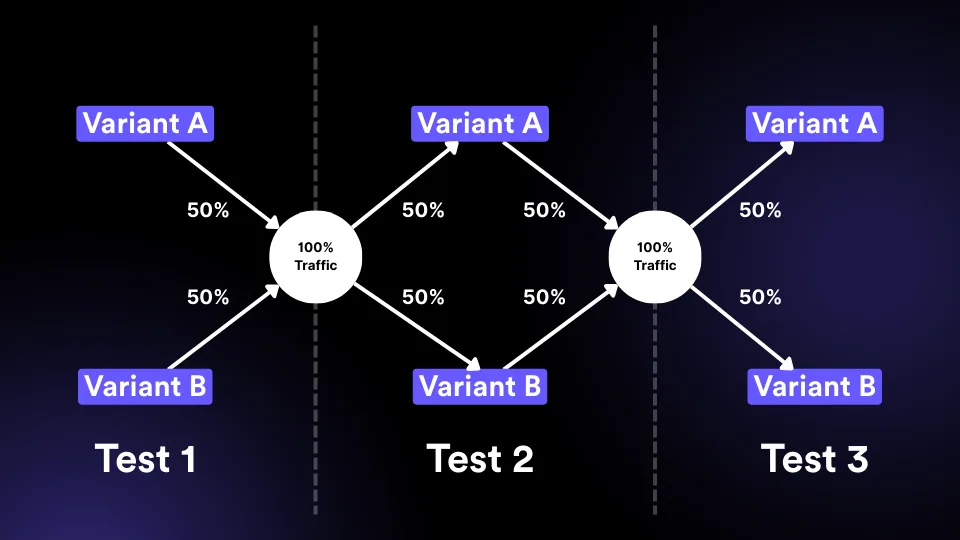
We use a parallel testing protocol with clean randomization, strict QA, and documented analysis — so multiple tests run simultaneously without turning the site into chaos.
The target: move from 1-2 tests per quarter to 5-10 tests running in parallel.
Independent assignment balances each control and variant across other active tests, so the readout stays statistically usable.
Pre-planned duration, MDE, 50/50 splits, SRM monitoring, and simple decision rules. No noise. No false positives sold as wins.
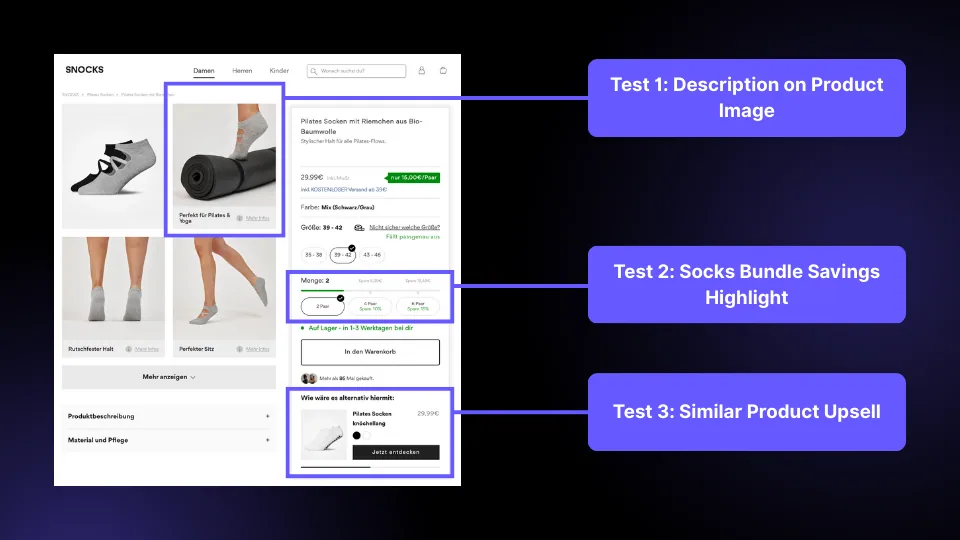
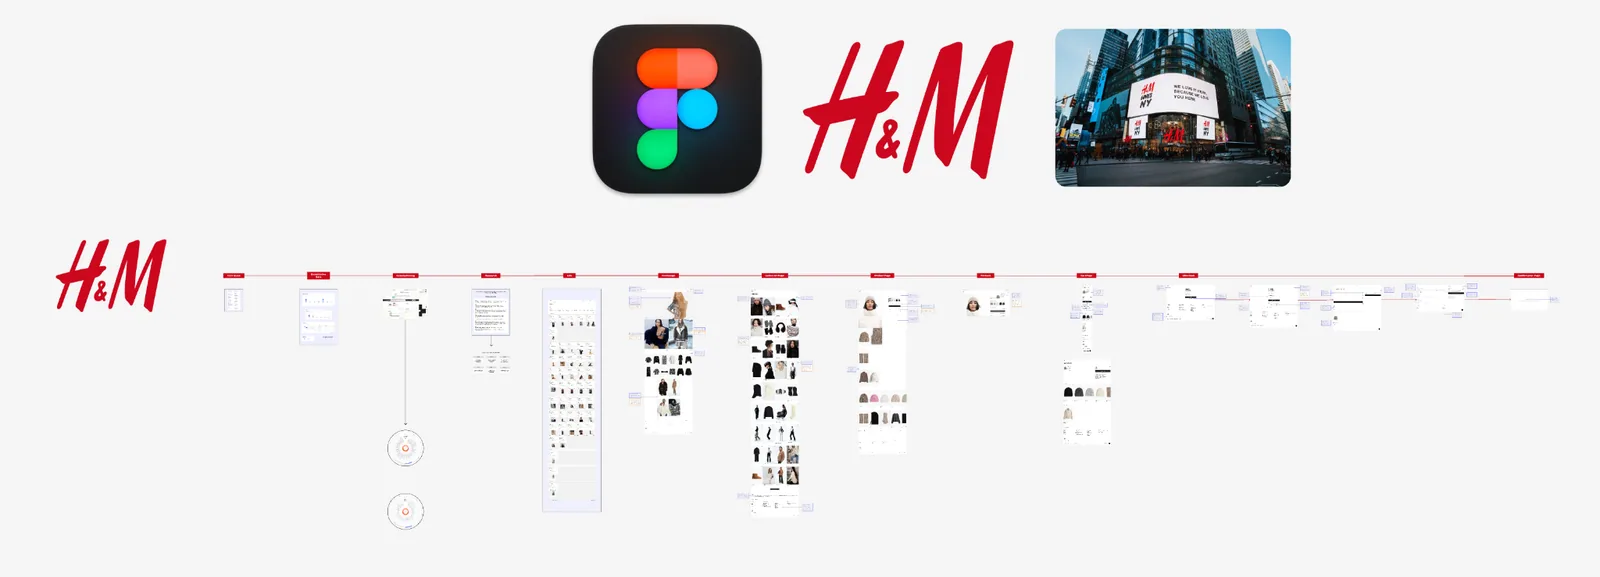
Every test gets a brief, 3-5 variations, mobile and desktop design, prototypes, tracking checks, and real-device QA before launch.
Multiple variants move through launch, QA and readout without turning the site into chaos.
03
Iterative prioritization
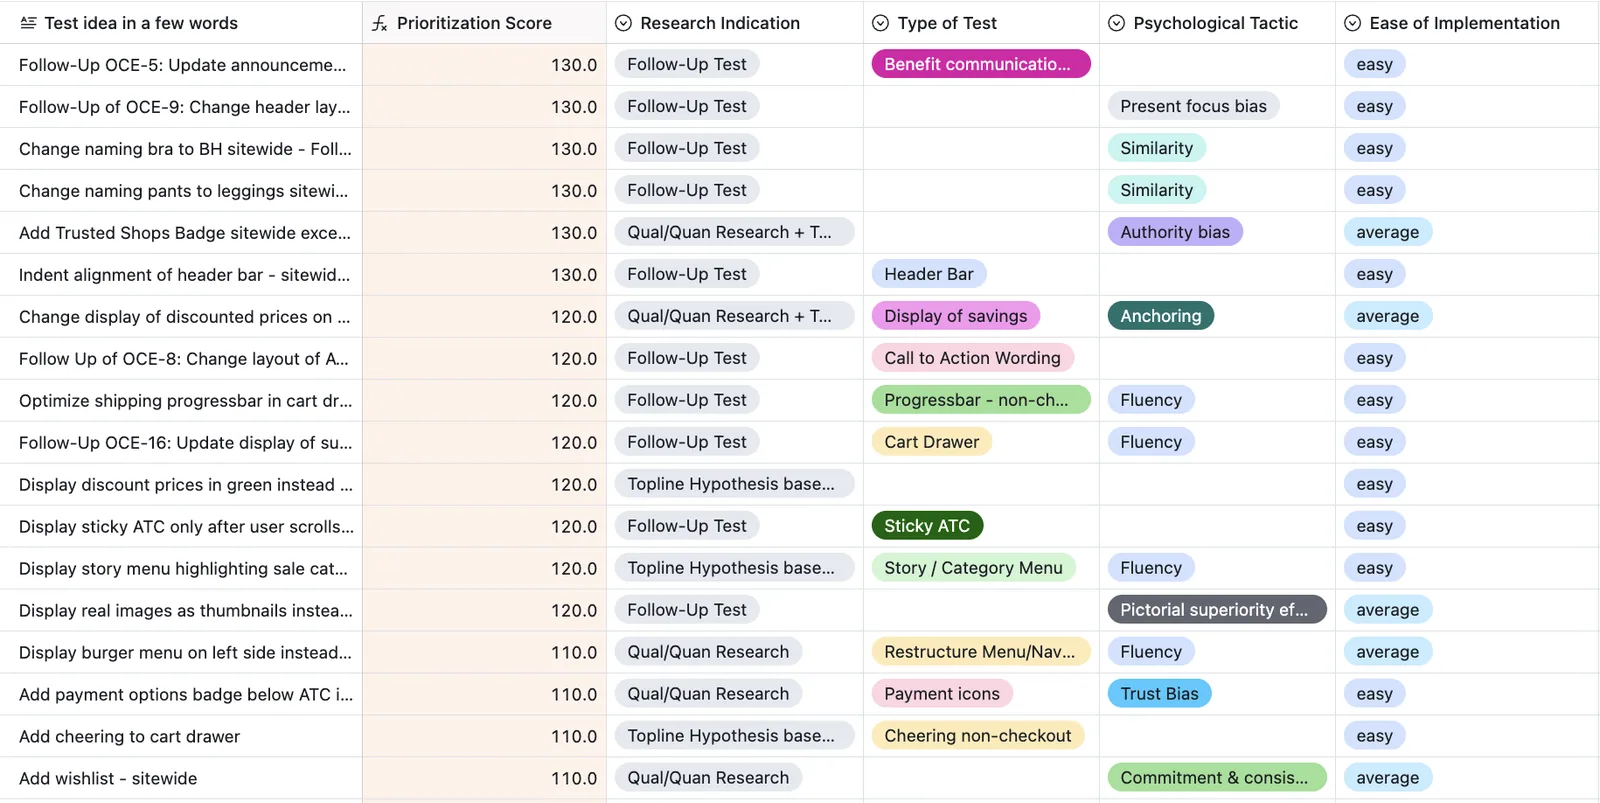
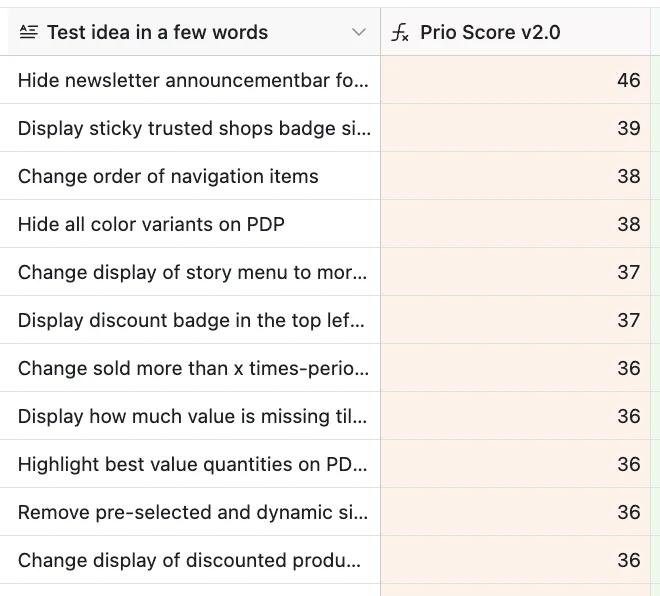
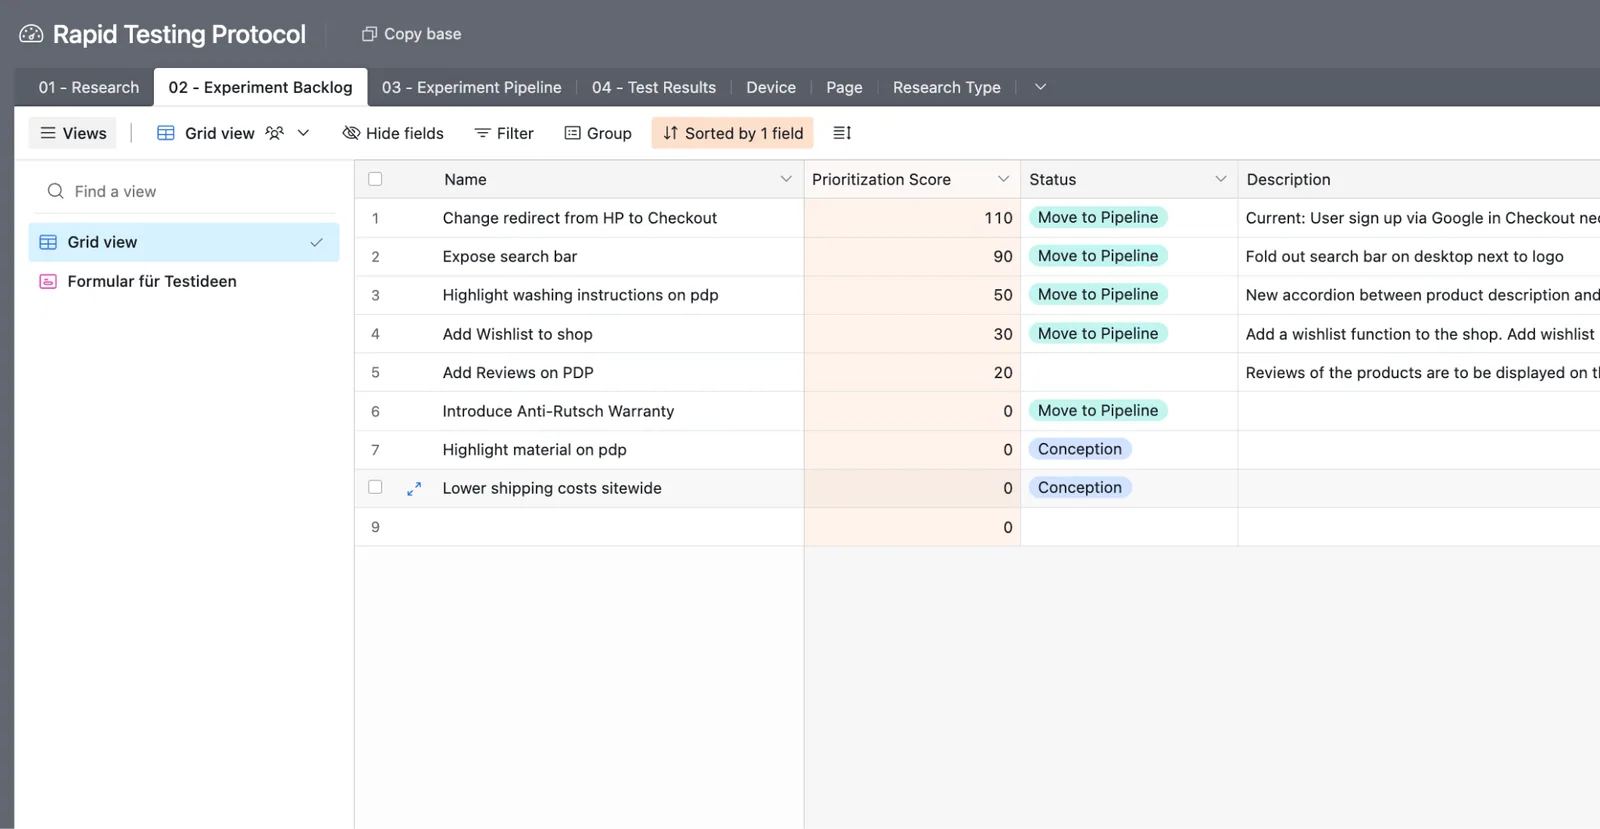
Every idea is scored against revenue exposure, visibility, research support, implementation effort and what similar experiments have done before. As results arrive, the roadmap gets smarter for that brand.
No loudest-voice wins. No easy-first tests. No competitor copying. No backlog burial.
Ideas are scored by where they run, how many people see them and how close the change is to revenue.
Research indication, funnel context and historical experiment data shape the score.
As tests succeed or fail, the model adapts to the brand, audience, industry and business goals.
Ideas rise by revenue exposure, research support and historical signal.
06 / What the work looks like
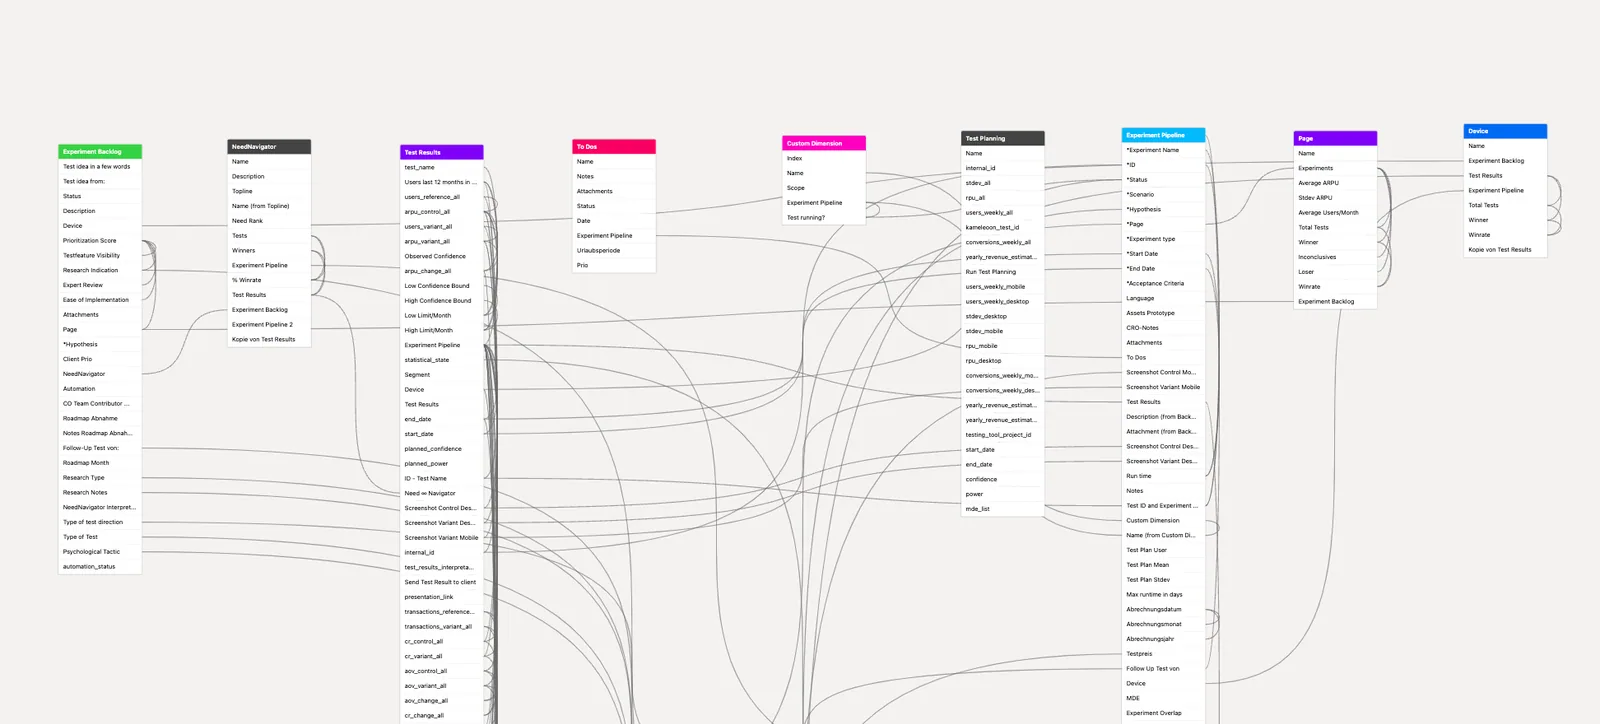
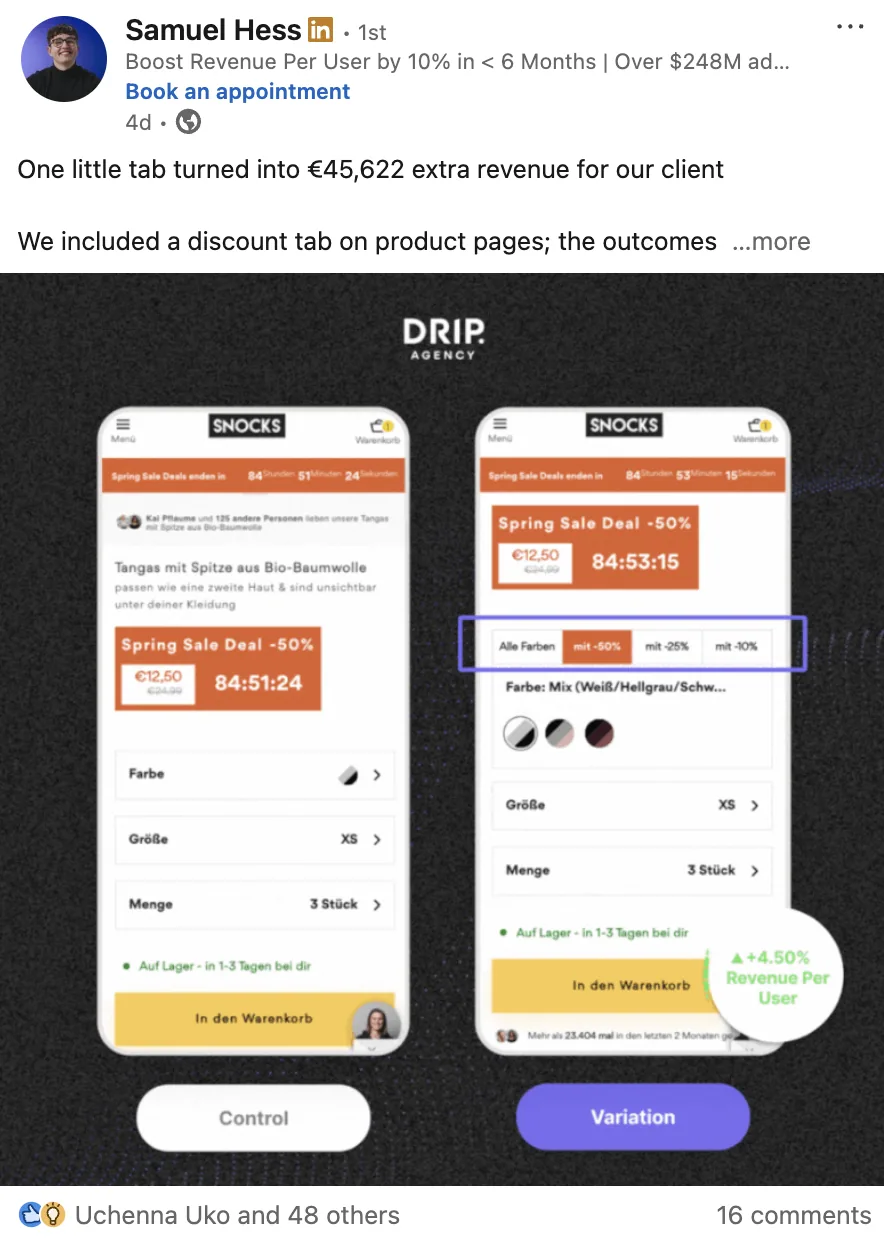
The artifacts below aren't decoration — they're the operating layer of the program. Hypothesis before design. Runtime checks during. Win-rate distributions after.
07 / Commercial proof
Each program is judged by whether the validated changes improve the economics of paid and organic traffic.
additional revenue
450+ experiments over five years turned the product page and broader funnel into a compounding revenue engine.
in 6 months
A first structured experimentation program gave the team a measurable path through rising acquisition costs.
conversion-rate lift
A higher-velocity test cadence helped move conversion from 0.59% to 2.7% over the engagement.
from 34 tests
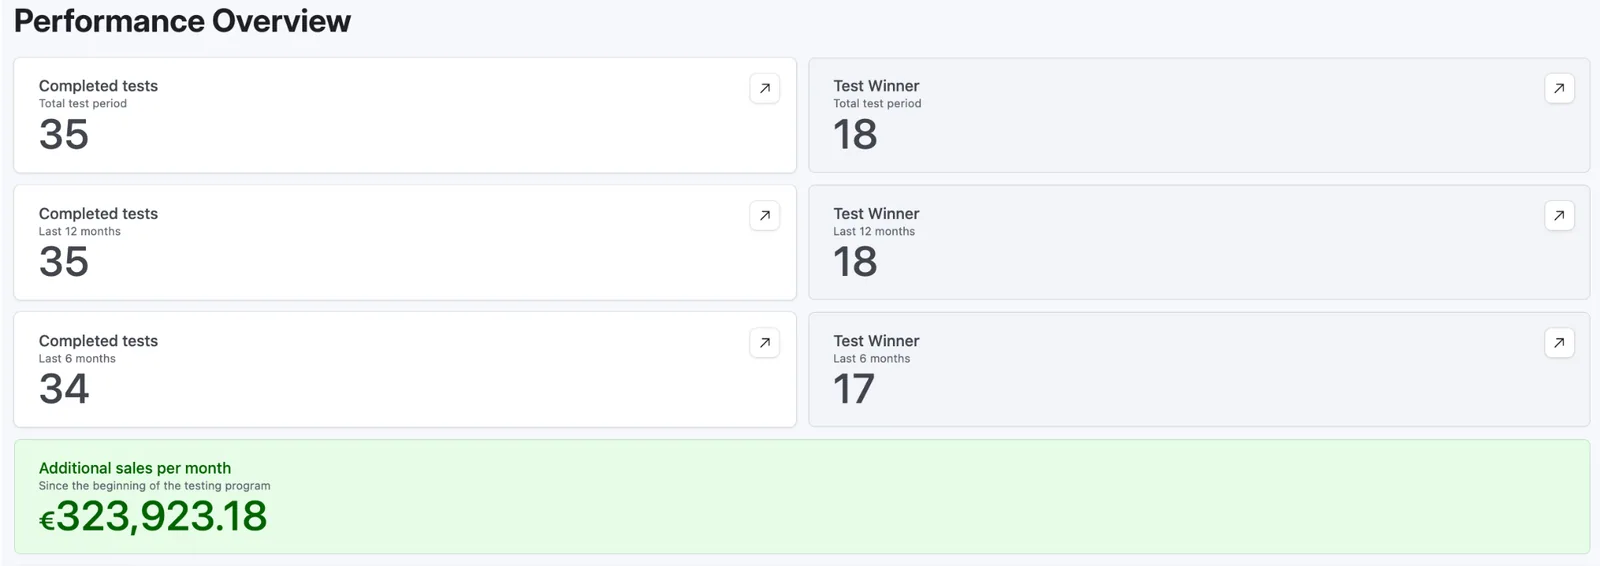
€323,923 in additional monthly revenue, six months after the brand emerged from insolvency.
08 / Behind the curtain
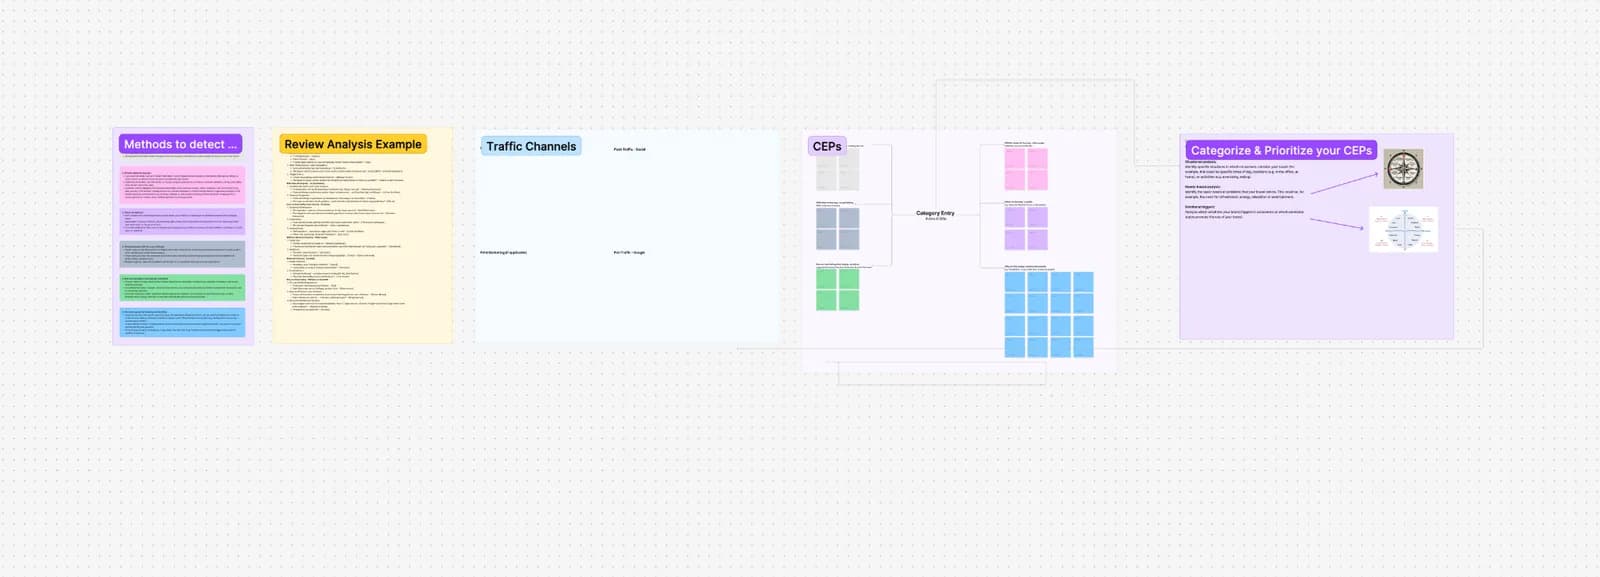
Research memory, experiment production, and executive reporting — each with its own dashboard, each visible to everyone on the program.
Research memory
Drivers, category entry points, objections, heatmaps and session insights are stored in one research layer.
Experiment production
Design briefs, prototypes, QA notes, launch state and result analysis are handled as a production workflow.
Executive reporting
The business view stays focused on RPU, expected uplift, shipped winners and the next highest-value bets.
09 / Expected economics
Single tests are often small. A disciplined system turns small validated improvements into durable acquisition advantage.
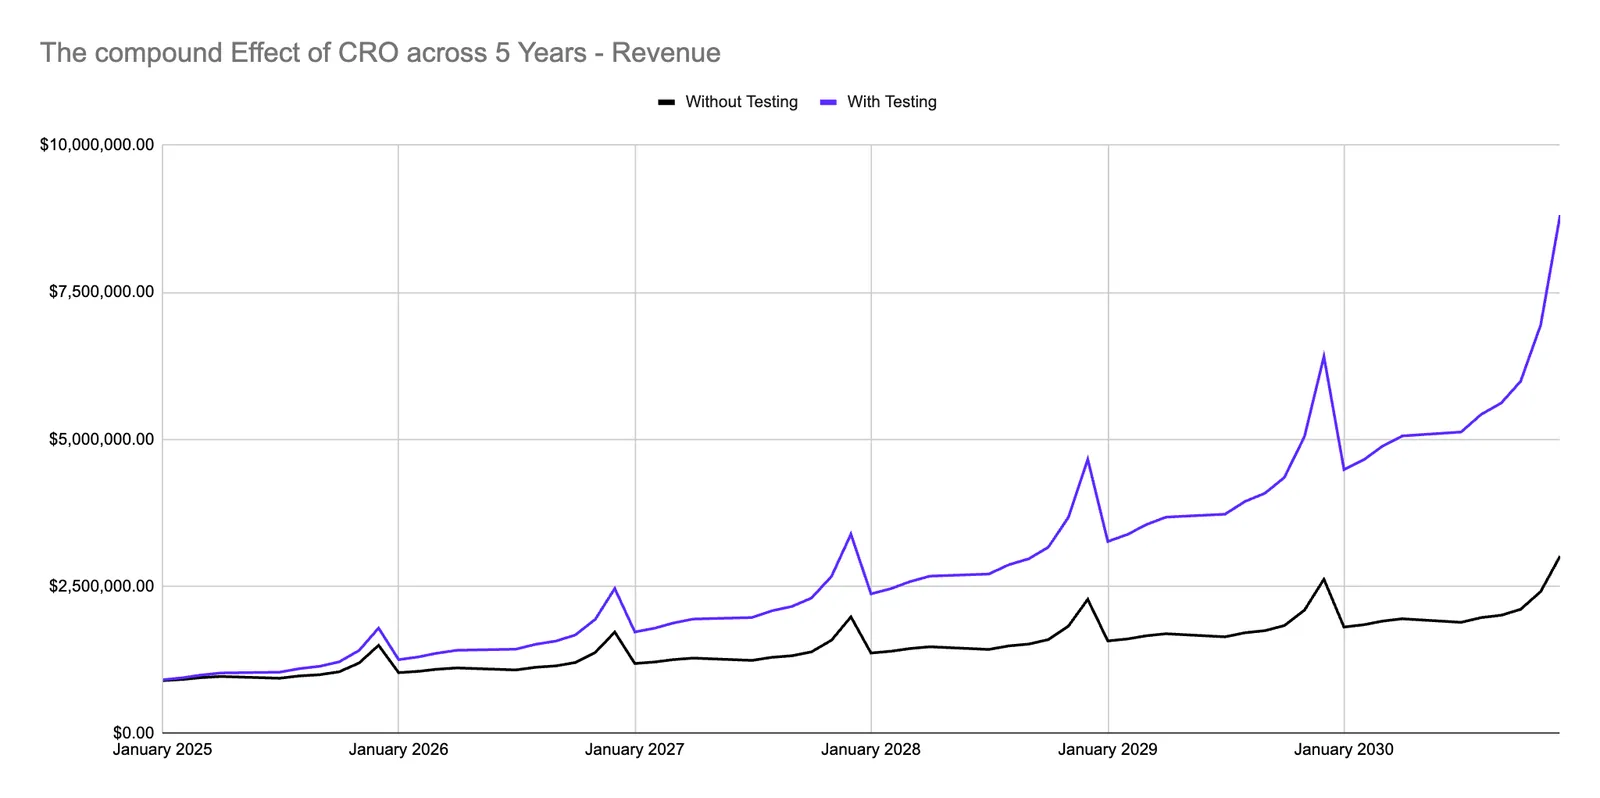
Small validated wins widen the revenue gap when they keep stacking.
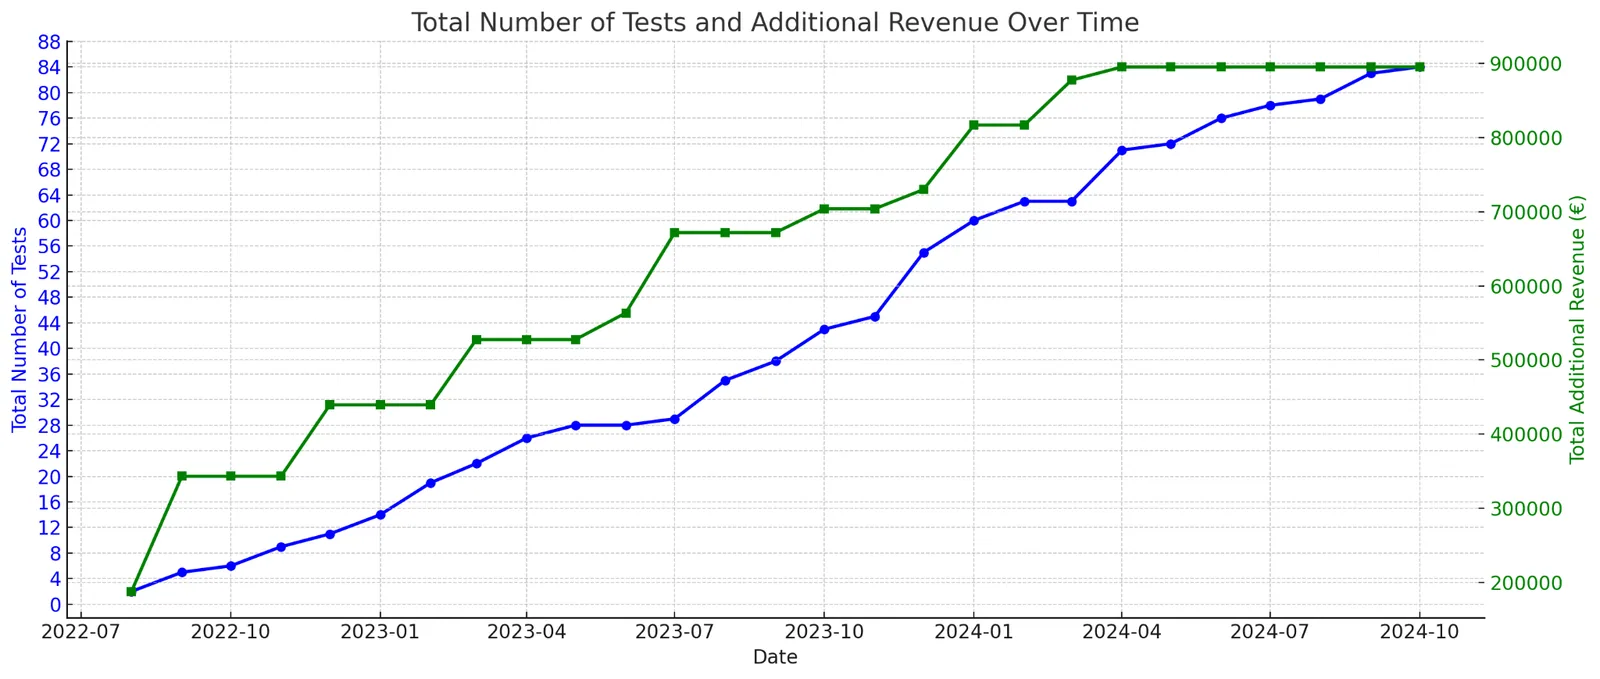
A 1.66% monthly lift compounds into roughly 10% revenue uplift over six months. That's the target architecture behind the protocol — and it beats any single-shot redesign on expected value.
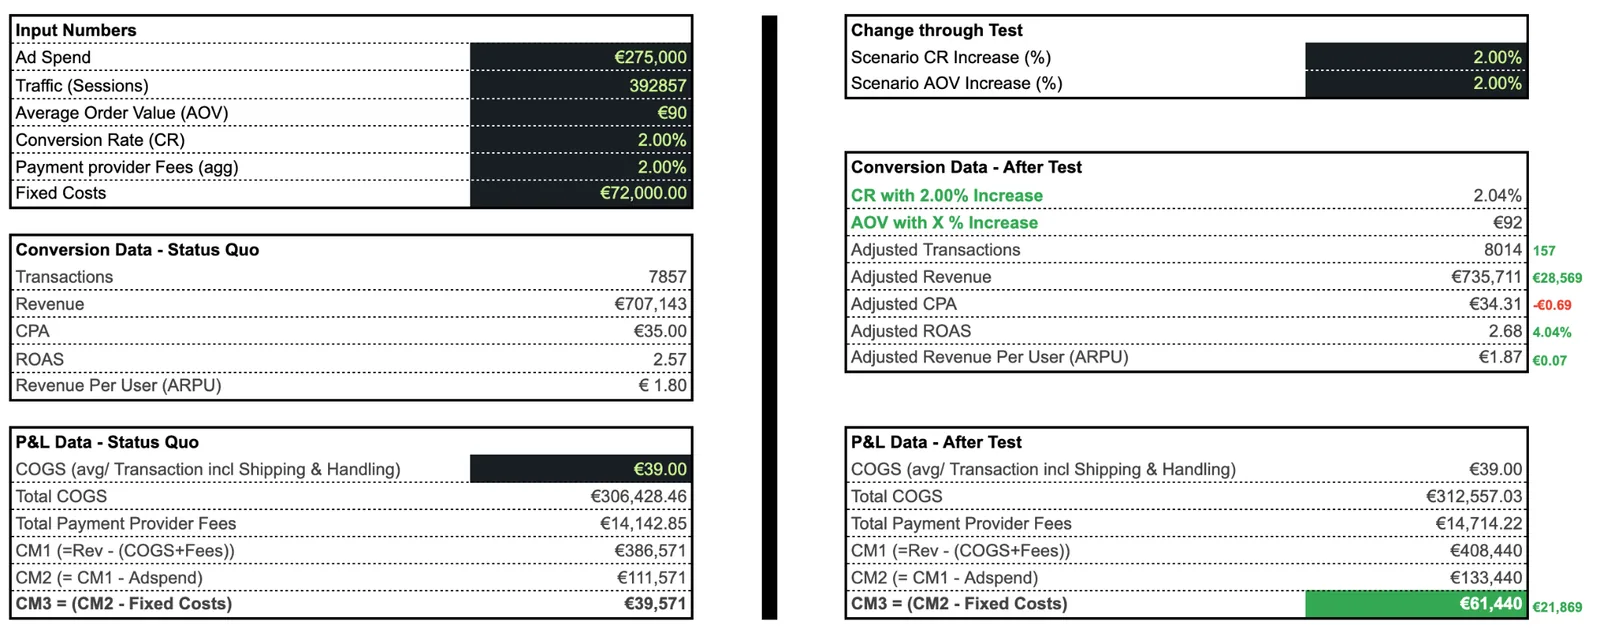
Higher CR and AOV create more profit per visitor. More profit per visitor means more room to outbid competitors on paid traffic. Compounding CRO and compounding ad budget feed each other.
Research, backlog, pipeline, and result interpretation live in the same system. Every test becomes reusable knowledge — for the brand, and for the next 250 brands we work with.
DRIP growth protocol
If you're serious about long-term growth, the next step is a 30-minute strategy call. We'll map whether this protocol fits your traffic, team, and economics — and tell you straight if it doesn't.
10 questions
DRIP Agency measures the 10% revenue per user (RPU) uplift guarantee by summing the relative uplift of all positive A/B tests over the engagement period. Each test uses controlled experiments with Frequentist statistical methodology at 80% confidence and power levels. Control and variant groups experience identical conditions through randomized traffic splitting, isolating the actual impact of each change from seasonal effects, marketing campaigns, or external factors. This is the same measurement approach validated across our 4,000+ documented experiments.
Three things. First, Quantum — our internal experiment database covers 4,000+ tagged tests across 9 ecommerce verticals, scored on 7 psychological drivers using the Fogg Behavior Model. No other CRO agency in Europe has a research asset of that depth. Second, parallel testing. Most programs run one or two tests per quarter. We run 6-10 simultaneously, using factorial experimental design with independent randomization. That's 3-5x the learning velocity. Third, the SNOCKS depth. We helped take SNOCKS from €150K/month to €80M+/year over five years and 450+ experiments — and then they invested in us. That kind of long-term, full-access program is what taught us what actually compounds.
DRIP Agency runs 6–10 A/B tests simultaneously using our Rapid Testing Protocol — parallel testing rather than sequential. Over a 6-month engagement, most clients complete 30–50+ experiments. This is 3–5x the velocity of traditional programs that run 1–2 tests per month (roughly 12 per year). The parallel approach follows factorial experimental design, the same methodology used by Microsoft, Google, and Meta. For example, Kickz completed 77 experiments over 3 years and saw conversion rates improve from 0.59% to 2.7%.
Yes. DRIP Agency, headquartered in Traunstein, Bavaria (Germany), works with e-commerce brands worldwide. Founded in 2019 by Fabian Gmeindl and Samuel Hess, our team of 50+ specialists operates in English and German. Our client portfolio of 250+ brands spans Europe, North America, and beyond, across verticals including fashion, food & beverage, health & wellness, sports, and home goods.
DRIP Agency primarily uses ABlyft and Kameleoon for A/B testing implementation. We never use visual editors — they introduce page speed degradation, implementation inconsistencies, and unreliable results across devices. Our tests integrate at the code level for clean, performant execution. QA is performed by a dedicated 10-person team using BrowserStack across real devices. Each test receives a full design brief, 3–5 design variations, interactive clickable prototypes for approval, and mobile/desktop coverage from day one.
DRIP Agency works alongside in-house CRO teams regularly. Our Research Hub, 4,000+ experiment database, and Weighted Impact Scoring prioritization engine augment what internal teams are already doing — we don't replace them. The research infrastructure provides customer psychology profiling (7 Psychological Drivers, Category Entry Points) that most in-house teams lack the tooling to produce, while the prioritization engine provides data-driven test selection based on cross-brand performance benchmarks.
Month 1 of DRIP Agency's engagement is the Research & Strategy Intensive, during which the first A/B tests are designed based on customer psychology profiling and funnel analysis. First tests go live by the end of Month 1. Most clients see their first winning tests within 2–3 months. Oceansapart generated +€323,923/month within 6 months. KoRo achieved €2.5M in additional revenue in 6 months. Results compound over time as the prioritization engine calibrates to your specific audience.
Losing tests are as valuable as winning tests in DRIP Agency's system — they reveal what doesn't work for your specific audience and feed directly into the Weighted Impact Scoring prioritization engine, improving future test selection. A well-run testing program expects roughly 40–50% of tests to be inconclusive or negative. DRIP maintains a 52.6% overall win rate across 4,000+ experiments — significantly above the 20–30% industry average. What matters is the net impact across all tests, which is why we guarantee a minimum 10% RPU uplift in 6 months.
DRIP Agency works with e-commerce brands across all verticals — fashion (SNOCKS, Oceansapart), food & beverage (KoRo, Livefresh), health & wellness (Blackroll), sports (Kickz), footwear (Giesswein), and more. Our methodology is audience-driven, not industry-driven. The 7 Psychological Drivers framework — Progress, Curiosity, Security, Status, Autonomy, Comfort, and Belonging — and Category Entry Point identification system adapt to whoever your customers are, producing relevant insights regardless of product category.
Yes — request a sample during your discovery call with DRIP Agency and we'll share an anonymized research report. The report demonstrates the full depth of our Research Hub analysis: customer psychology profiling using the 7 Psychological Drivers, Category Entry Point identification, quantitative funnel analysis, heatmap and session recording insights, and the prioritized opportunity roadmap with Weighted Impact Scores. The research report typically runs 20+ pages and serves as the foundation for the entire testing roadmap.