01Research-Diagnose
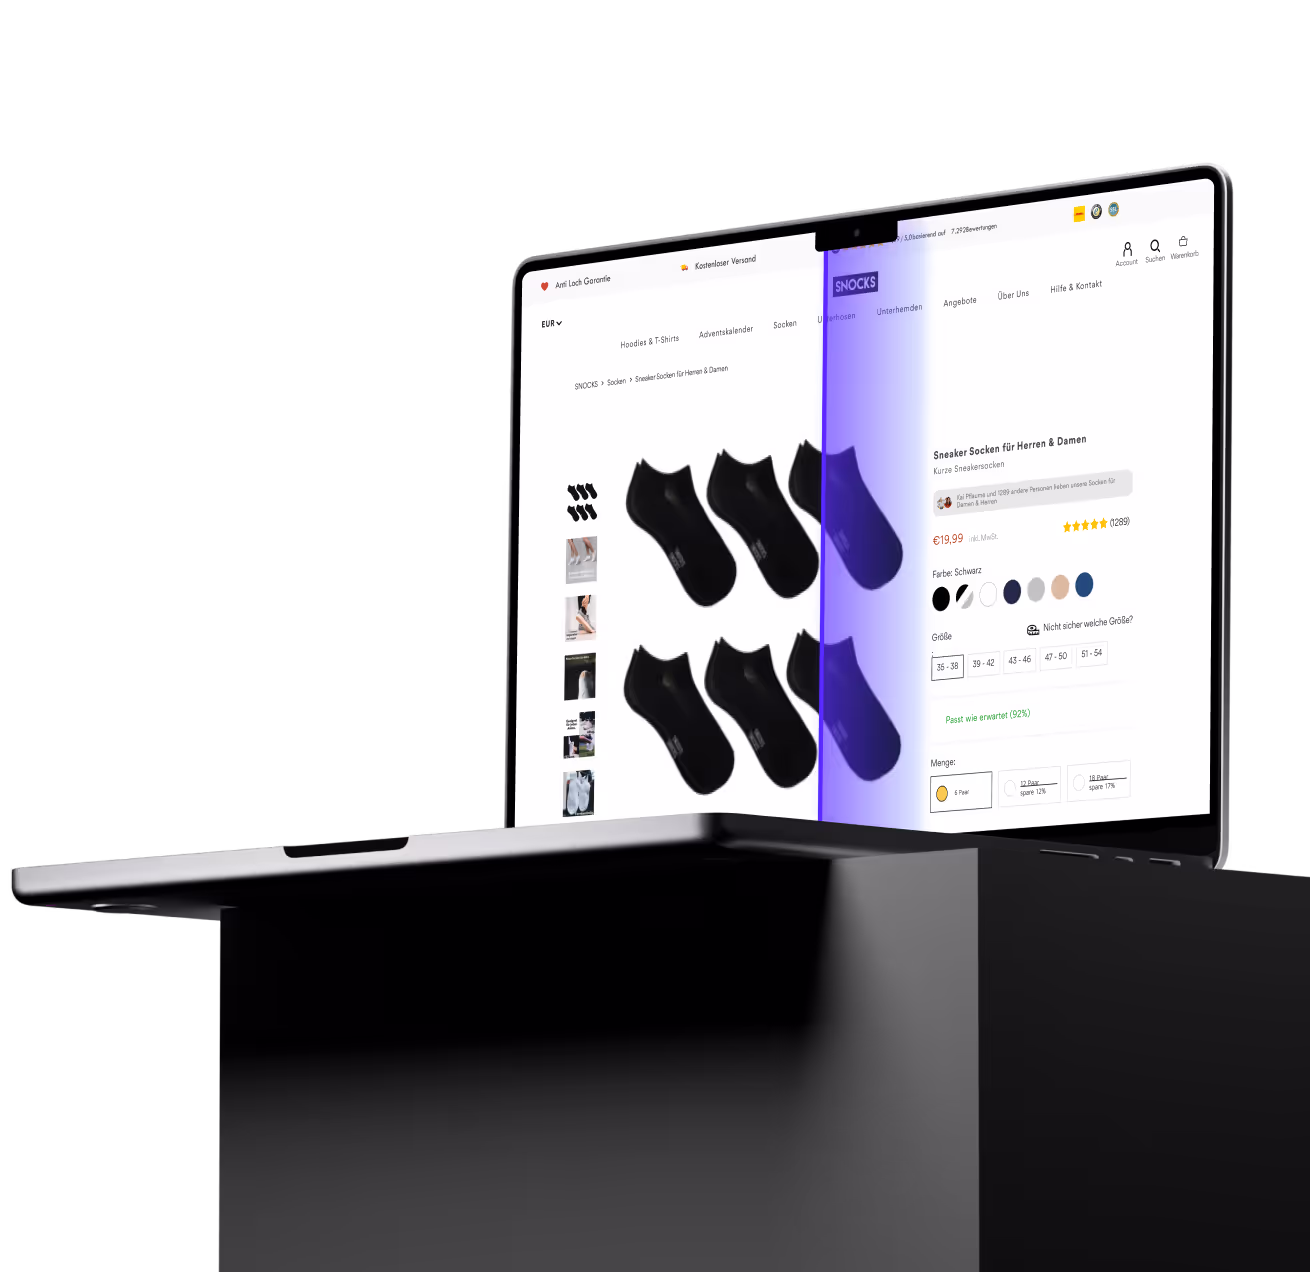
Search, swatches, and size selection showed where shoppers were working too hard
 Fashion / Underwear DTC
Ein fünfjähriges Conversion-Betriebssystem aus Predictive Consumer Research, Rapid A/B Testing und iterativer Priorisierung, während Revenue per User um 148% stieg.
SNOCKS started as an Amazon seller doing €2M/year with razor-thin margins and no A/B testing infrastructure. Over five years of partnership with DRIP, we ran 350+ A/B tests — more than 100 of them winners — and generated €8.2M in additional revenue. Revenue per user grew from €2.01 to €4.99 (+148%), average order value climbed from €29 to €51, and SNOCKS scaled profitably from €2M to over €50M in annual revenue. The key: while most brands see RPU drop as they scale, SNOCKS saw it increase every single year.
Jede Case-Study-Schicht hält die Artefakte auf der Seite: aktuelle Shop-Screenshots, Research Boards, Priorisierungsoutputs, Test-Evidenz und Impact Charts.
Search, swatches, and size selection showed where shoppers were working too hard
The work became a backlog, not a one-off redesign
Der schwierige Teil war nicht ein Redesign. Es ging darum, das Kaufsystem bei steigendem Traffic und breiterer Audience immer schärfer zu machen.
The old PDP was a functional Shopify page. The live 2026 page is a tested buying system: clearer bundles, visual color selection, trust signals, sizing support, and merchandising that helps shoppers buy more confidently.
SNOCKS is a German DTC underwear and basics brand founded by Johannes Kliesch. Starting as an Amazon seller, the brand migrated to Shopify to build a direct-to-consumer channel — but faced the fundamental challenge every DTC brand encounters: making the economics work when you're spending heavily on acquisition.
With an average order value of just €29 and low margins on basics products, SNOCKS couldn't profitably scale ad spend. Every additional customer acquired cost more than the previous one, and the revenue generated per visitor wasn't growing fast enough to compensate. They needed a way to extract more value from every user who landed on the site.
The core problem wasn't traffic — SNOCKS was good at driving visitors to the site. The problem was that those visitors weren't converting at a rate or value that made the acquisition economics work at scale.
Revenue per user was stuck at €2.01. AOV was €29 — barely enough to cover acquisition costs on some channels. And with no structured testing infrastructure, the team was making product and UX decisions based on gut feeling and competitor copying rather than actual customer data.
SNOCKS needed to fundamentally change the relationship between acquisition costs and revenue per visitor. Not incrementally — exponentially.
The first phase was not guessing at redesign ideas. We combined analytics, heatmaps, session recordings, and product-page behavior to see where attention clustered but purchase confidence did not.
We started with a deep consumer psychology research intensive. Through qualitative and quantitative analysis, we identified the psychological drivers that influence purchase decisions for basics and underwear — from fit anxiety to bundle value perception to repeat purchase motivation.
From there, we built a rapid testing protocol specifically designed for SNOCKS' traffic volumes and product catalog. Instead of running 1-2 tests per month sequentially, we ran 6-10 experiments simultaneously, each grounded in specific psychological drivers identified in the research phase.
The compounding effect was critical. Each winning test didn't just generate a one-time uplift — it became the new baseline. And the learnings from each experiment (winners and losers) informed the next wave of hypotheses. As Jeff Bezos said: "Our success is a function of how many experiments we do." Getting 1% better every month compounds dramatically over years.
Every research finding was translated into an experiment backlog with page type, expected impact, confidence, effort, and psychological driver. That made it possible to run multiple tests in parallel while preserving learning quality.
The SNOCKS program was not a redesign project. It was a conversion operating system built around one thesis: to convert strangers profitably, you have to improve the quality of test ideas, the rate of testing, and the success rate of decisions at the same time.
Sharper hypotheses before design work starts
More valid experiments running in parallel
Every result improves the next roadmap decision
Jede validierte Änderung hebt die nächste Baseline und zeigt dem nächsten Sprint, was getestet werden sollte.
Research Hub combined feature extraction, psychological drivers, buying motivations, category entry points, and personality traits into one buyer model. SNOCKS shoppers were practical, comfort-led, skeptical of hype, and highly responsive to proof when proof removed daily friction.
The test roadmap stopped being a list of page ideas and became a behavioral model: prove comfort, reduce first-order risk, make fit easier, and remove hidden effort from high-intent paths.
Reviews, heatmaps, session recordings, search behavior, and Research Hub analyses were treated as one evidence base.
We mapped comfort, security, autonomy, fairness, and fit certainty into decision drivers.
Every insight translated into a page surface, proof mechanism, and measurable learning goal.
Once the buyer model was clear, hypotheses were split across PDPs, PLPs, cart, navigation, and offer modules. SNOCKS had enough traffic and access for a parallel testing system, so learning velocity became a growth lever.
The goal was not to find one miracle winner. It was to create enough high-quality shots on goal that the business could compound small wins while learning from every loss.
Research-backed ideas were split across the places where purchase confidence or product discovery broke down.
The team moved from slow sequential testing to a portfolio of controlled experiments running at once.
Every test produced rollout decisions and a sharper understanding of what the buyer needed next.
Ideas were not kept in a static backlog. They were scored by customer evidence, page type, expected impact, effort, confidence, and research signal, then re-ranked as new test results came in.
Prioritization was the bridge between research and revenue. The backlog forced scientific discipline: strongest signal, clearest hypothesis, highest impact, lowest wasted effort.
Each idea had to earn its place through customer signal strength and expected business value.
Tests were grouped and sequenced so one result could de-risk the next wave.
Winners became baselines, losers became constraints, and the next sprint got more precise.
Comfort was the strongest positive pull, with 780 recurring mentions.
The buyer was not looking for exciting basics. They wanted underwear and socks they could stop thinking about.Comfort, security, and autonomy scored as the highest decision drivers.
The promise only worked when shoppers also believed sizing, guarantees, and returns were predictable.Fit certainty had the largest modeled conversion upside.
People liked the product promise, but hesitation concentrated around first-order risk.Search users converted at 19.24%, but only 0.08% used site search.
High-intent visitors were telling us what they wanted, but the path to express intent was hidden.The strongest opportunity was not a new visual style. It was a sharper model of what shoppers needed to believe before buying: comfort as the pull, durability and sizing as the trust risks, and fairness as the conversion guardrail.
Day-long comfort, soft feel, no pinching, no rolling, and a second-skin fit were the strongest repeat-purchase signals.
Reports of holes, seam failures, and fabric thinning made durability the largest trust-risk topic despite strong comfort sentiment.
Small sizing, color or batch variability, thigh fit, and shrinkage made first-time trial feel riskier than a basics purchase should.
The guarantee accelerated first purchase, but the 6-month window could also trigger skepticism when failures happened later.
When sizing felt uncertain, paid returns became a much larger source of perceived unfairness and purchase anxiety.
Die Seite hält Kontroll-, Varianten- und Ergebnis-Screenshots sichtbar, damit die Fallstudie die Evidenz hinter jedem Claim zeigt.
Users who used site search had a 19.24% conversion rate vs 6.87% for non-searchers. But only 0.08% of users actually used search (1,653 of 2.1M visitors) — because it was barely visible. Using the BJ Fogg Behavior Model, we identified that ability (finding the search) and trigger (prompting the action) were both broken. We made search prominent and accessible.
Product color selection used abstract color dots that required cognitive effort to differentiate. We replaced them with real product image thumbnails, reducing the cognitive load for comparing options. Customers could instantly see what each color variant looked like on the actual product.
Recent PDP test from the Research Hub: the variant added a tactile fabric close-up into the product gallery. It reduced uncertainty around material quality and gave shoppers a more concrete reason to trust the basics product before choosing a bundle.
Tested different approaches to cross-sell recommendations on PDPs and in the cart, focusing on relevance and timing of the recommendation. The strongest variants aligned suggestions with the psychological driver of completeness: completing a set rather than adding random products.
A Research Hub winner on unisex PDPs: adding a secondary 'Complete the look' CTA below Add to Cart gave shoppers a low-friction path into complementary products without competing with the primary purchase action.
Over five years, the partnership generated €8.2M in additional revenue attributed directly to CRO efforts. But the real story is in the compounding: revenue per user grew from €2.01 to €4.99 — a 148% increase that happened while SNOCKS was scaling from €2M to €50M+ in annual revenue.
This is extremely unusual. Most brands see RPU drop as they scale because they reach less-qualified audiences. SNOCKS saw it increase every single year. That's the compounding effect of systematic, psychology-driven testing at high velocity.
Average order value grew from €29 to €51 — not through discounting or artificial bundling, but through genuinely understanding what customers valued and making it easier for them to buy more of what they wanted.
The partnership continues today, with DRIP remaining SNOCKS' conversion optimization partner since 2019.
The SNOCKS case demonstrates that CRO isn't about finding one silver bullet test. It's about building a system that compounds learning over time. With 350+ experiments, the vast majority of individual tests had modest impacts. But layered together, they created a fundamentally different business.
The critical insight: volume matters more than any individual test's impact. Running 100+ experiments per year — grounded in real consumer psychology, not guesswork — creates a compounding advantage that competitors running 12 tests a year simply can't match.
For brands in the €2M-€10M range looking to scale: your bottleneck probably isn't traffic or product. It's how much revenue you extract from each visitor. Fix that, and the acquisition math works at every scale.
DRIP played a crucial role in our growth, generating an additional €14.2M revenue for us. They supported us every step of the way — from underdogs to market leaders. Their expertise helped us stay profitable, giving us the foundation to scale and dominate our market.
Founder, SNOCKS
Buche ein kostenloses Strategiegespräch und wir zeigen dir, was psychologiebasierte CRO für deine Marke leisten kann.